So there I was, casually checking my Home Assistant Energy Dashboard, y’know like the average person does every Sunday morning, when I noticed something… off. According to my dashboard, I’d consumed 2,425,370.32 kWh of electricity in 2025. For context, that’s roughly the annual consumption of a small industrial facility. My electricity bill? A cool CA$242,533.56.
Yeah, no.
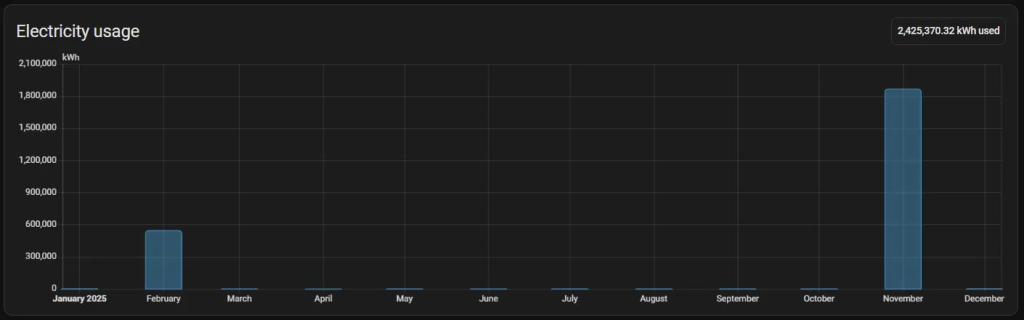
Unless my utility company has been giving me one hell of a discount, something was very, very wrong.
The Rabbit Hole Begins
My actual usage should be around 17,000-20,000 kWh per year… pretty normal for a small Canadian home where someone yells ‘put on a sweater’ instead of touching the thermostat. But somewhere along the line, my Z-Wave energy meter had hiccups that corrupted the statistics database, and those hiccups compounded into millions of phantom kilowatt-hours.
On top of the energy insanity, Developer Tools → Statistics was showing about 200 entities with “no state available for this entity” errors. My database was a mess.
Time to roll up my sleeves.
The First Gotcha: Which Database Are You Even Using?
Before I get into the actual fix, let me save you a headache I gave myself.
I SSH’d into my Home Assistant box and started poking around the SQLite database at /config/home-assistant_v2.db. Ran some queries. Empty tables. Zero rows. Nothing made sense.
After way too long trying to figure out why my database seemed empty, I checked the file size: 946KB, dated December 2022.
Then it hit me – back in 2022 when I set up this instance, I installed the MariaDB add-on and configured the recorder to use it. Four years later, I’d completely forgotten about that. The SQLite file was just a leftover from initial setup, sitting there like a decoy, wasting my time.
Before you do anything else: Check your configuration.yaml for a recorder: section with a db_url pointing to MariaDB (or PostgreSQL, or whatever). If you’re using an external database, that’s where your data lives… not in the default SQLite file.
With that sorted, let’s get into the actual fix.
First Attempt: The UI “Fix” (Spoiler: Don’t Do This)
Home Assistant has a built-in outlier detection tool under Developer Tools → Statistics. You click on your entity sum button, hit “Outliers,” and it shows you the suspicious values. Perfect, right?
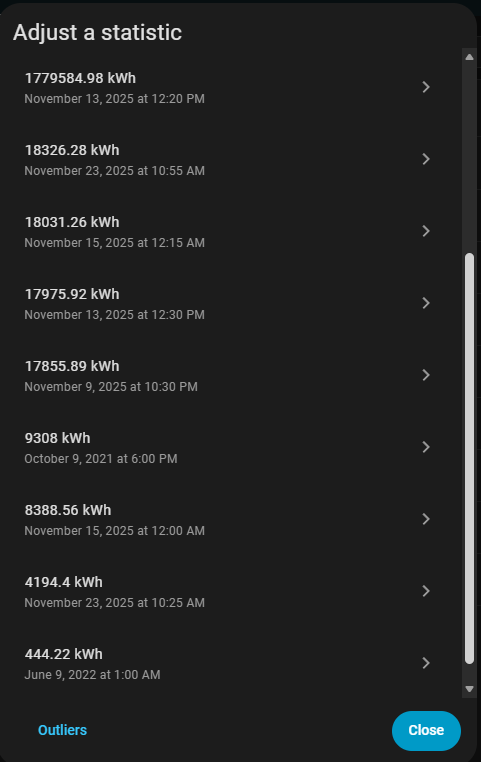
I found the culprits – entries showing 1,797,562 kWh and 543,457 kWh for single hours. The UI lets you “Adjust” these values, so I set them to 0.
This was a mistake.
The UI apparently adjusts values as deltas, not absolutes. When I set that 1.7 million kWh entry to 0, it created a -1.7 million kWh entry right after it. Now I had negative millions cascading through my data. Fantastic.
Lesson learned: For anything beyond minor tweaks, skip the UI and go straight to SQL.
The Real Fix: MariaDB Surgery via phpMyAdmin
With phpMyAdmin connected to my actual database, I could finally see what I was dealing with.
Disclaimer: Don’t just copy and paste my SQL queries without understanding what they are doing, the IDs and numbers below are from my database. Running them blindly on yours will break things. Copy the methodology, not the numbers!
Here’s the game plan that actually worked:
Step 1: Backup Everything
Before touching anything, create backup tables:
CREATE TABLE statistics_backup AS SELECT * FROM statistics;
CREATE TABLE statistics_short_term_backup AS SELECT * FROM statistics_short_term;
Future you will appreciate this.
Step 2: Find Your Entity’s metadata_id
SELECT id, statistic_id FROM statistics_meta WHERE statistic_id LIKE '%energy%';My grid sensor (sensor.home_energy_meter_electric_consumption_kwh) had metadata_id = 50.
Step 3: The Monthly Anomaly Query (This is Gold)
Instead of scrolling through thousands of rows, this query shows you which months have suspicious activity:
SELECT
    DATE_FORMAT(FROM_UNIXTIME(start_ts), '%Y-%m') as month,
    MIN(sum) as month_start_sum,
    MAX(sum) as month_end_sum,
    MAX(sum) - MIN(sum) as month_change
FROM statistics
WHERE metadata_id = 50
AND start_ts BETWEEN UNIX_TIMESTAMP('2025-01-01') AND UNIX_TIMESTAMP('2026-01-01')
GROUP BY DATE_FORMAT(FROM_UNIXTIME(start_ts), '%Y-%m')
ORDER BY month;
When a month shows 500,000+ kWh change instead of the expected 1,000-2,000 kWh, you know where to dig.
Step 4: Drill Down to the Exact Spike
Once you know the month, narrow it down:
SELECT s.id, FROM_UNIXTIME(s.start_ts) as start_time, s.sum
FROM statistics s
WHERE s.metadata_id = 50
AND s.start_ts BETWEEN UNIX_TIMESTAMP('2025-02-18 12:00:00') AND UNIX_TIMESTAMP('2025-02-18 20:00:00')
ORDER BY s.start_ts;
And there it was, at 15:00 on February 18th, the sum jumped from 73,492 to 616,950. A spike of 543,457 kWh in one hour. Unless I was secretly running a Bitcoin mining operation, that’s not real.
Step 5: Fix the Spike
The sum column is cumulative, so every row after the spike inherited the inflated baseline. The fix is to subtract the spike amount from that row and ALL subsequent rows:
UPDATE statistics
SET sum = sum - 543457.916
WHERE metadata_id = 50
AND id >= 2863587;
Rinse and repeat for every spike you find.
The Spikes I Found (kWh)
| Date | Time | Jump From | Jump To | Spike Amount |
|---|---|---|---|---|
| 2025-02-18 | 15:00 | 73,492 | 616,950 | 543,457 |
| 2025-11-09 | 22:00 | 84,761 | 102,620 | 17,858 |
| 2025-11-15 | 00:00 | 102,793 | 129,214 | 26,420 |
| 2025-11-23 | 10:00 | 85,227 | 107,748 | 22,521 |
But Wait, There’s More: The Cost Entity
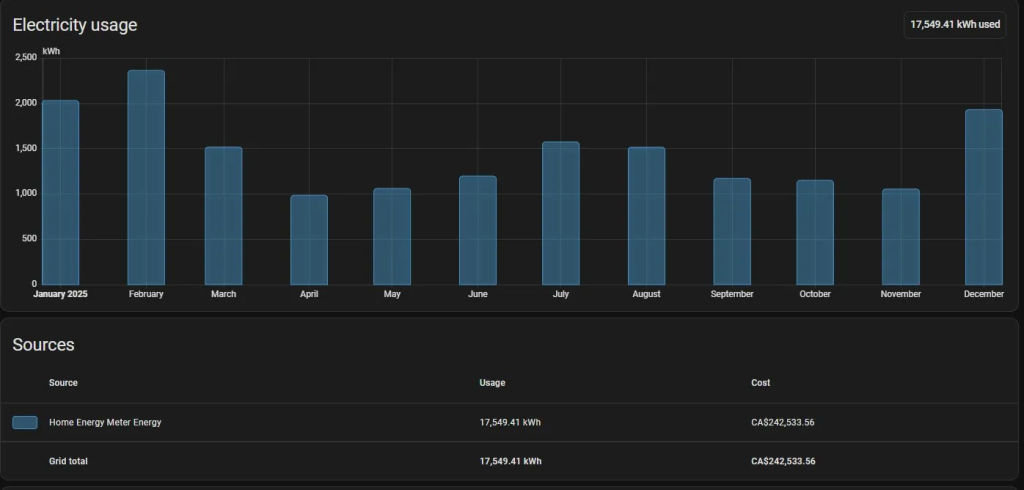
After fixing the kWh data, my energy chart looked great. But the cost still showed $242,533. That’s because Home Assistant auto-generates a separate cost entity that now has its own corrupted sum values.
Same process. Find the cost entity’s metadata_id, run the monthly query, find the spikes, fix them. I won’t bore you with all the details, but I found 8 more spikes in the cost data spanning October 2024 through November 2025.
The Plot Twist Nobody Warned Me About: statistics_short_term
After all my fixes, I rebooted Home Assistant feeling pretty smug. Checked the dashboard the next hour and… January 2026 was showing 42,000 kWh.
What the hell?
Turns out, Home Assistant has TWO statistics tables:
statistics– Long-term hourly aggregates (what I’d been fixing)statistics_short_term– 5-minute snapshots that feed INTO the long-term table
Every hour, HA aggregates the short-term data into long-term data. My statistics_short_term table still had 26,003 rows with corrupted sums around 699,000 kWh. Every hour, it was re-corrupting my beautiful clean data.
SELECT COUNT(*)
FROM statistics_short_term
WHERE metadata_id = 50
AND (sum > 100000 OR sum < 0);
-- Result: 26,003 rows of garbage
The fix:
UPDATE statistics_short_term
SET sum = sum - 610267
WHERE metadata_id = 50
AND (sum > 100000 OR sum < 0);
26,003 rows fixed in 2.5 seconds. Now the short-term table feeds correct values into long-term, and everything stays clean.
The Final Result
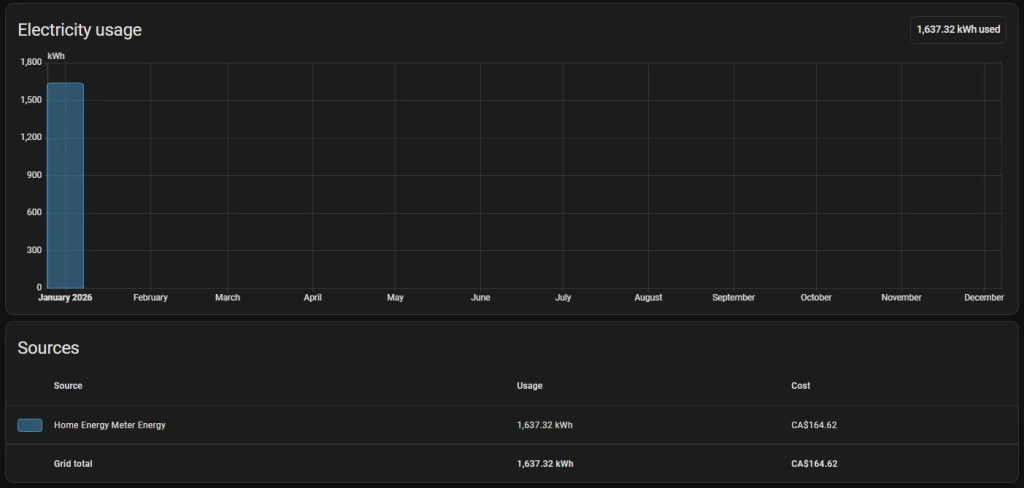
1,637.32 kWh for January 2026. CA$164.62 in costs. That’s more like it.
Why Does This Happen?
Z-Wave devices (and other wireless sensors) occasionally report garbage values during:
- Mesh communication hiccups
- Device restarts
- RF interference
- Firmware glitches
The sensor briefly reports 0 (or some absurd value), then immediately returns to the correct reading. Home Assistant sees:
- 73,492 kWh (correct)
- 0 kWh (glitch)
- 73,493 kWh (correct)
And interprets that jump from 0 → 73,493 as actual consumption. Boom, 73,493 phantom kWh added to your stats.
Prevention: Filtered Template Sensors
To prevent future spikes, create a template sensor that rejects invalid readings:
template:
  - sensor:
      - name: "Grid Energy Filtered"
        unit_of_measurement: "kWh"
        device_class: energy
        state_class: total_increasing
        state: "{{ states('sensor.home_energy_meter_electric_consumption_kwh') | float(0) }}"
        availability: "{{ states('sensor.home_energy_meter_electric_consumption_kwh') | float(0) > 1 }}"
The availability template makes the sensor report as “unavailable” instead of 0 when garbage data comes through. HA’s energy dashboard ignores unavailable states rather than counting them as consumption.
Important caveat: If you swap your Energy Dashboard to use this new filtered sensor, you’ll lose all your historical data. The new sensor has no history – it just started existing.
My approach: I’m keeping my original sensor in the Energy Dashboard (now that it’s cleaned up) and letting the filtered sensor build up history in the background. If another spike corrupts my data months from now, I’ll have the filtered sensor ready with clean history to switch to. It’s not a perfect solution, but I’d rather have years of (now corrected) data than start from scratch.
Key Takeaways
- Check which database you’re actually using – SQLite vs MariaDB matters
- Don’t use the UI “Adjust” feature for major fixes – It creates delta adjustments that cascade into more problems
- The monthly aggregation query is your best friend – Quickly identifies problem months
- Fix BOTH kWh and cost entities – They’re linked but stored separately
- Don’t forget
statistics_short_term– It feeds intostatisticshourly - Restart HA after database fixes – Clears the in-memory cache
- Filtered template sensors prevent future pain – Stop the garbage at the source
If you’ve made it this far, congrats – you’re either as stubborn as I am, or your dashboard is just as broken. Either way, good luck!
Now if you’ll excuse me, I need to go explain to my wife why I spent half a day arguing with a database instead of doing something productive.