
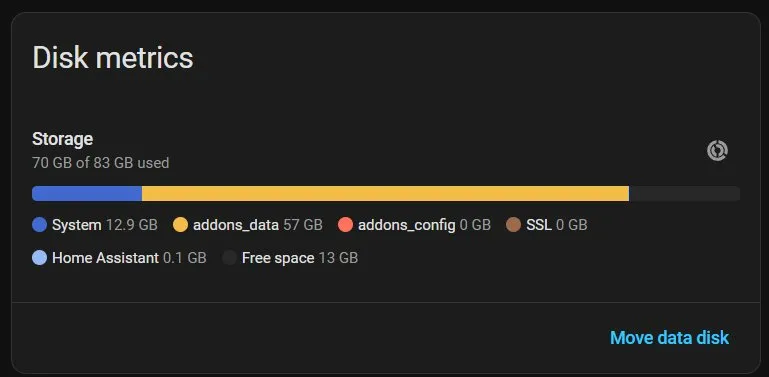
If you read my last post about Home Assistant backups going missing a few weeks ago, you’ll remember I had a secondary problem lurking in the background. My MariaDB addon was eating 57GB of disk space, and it was the main reason my backups kept failing.
Time to figure out what the hell is going on in there.
The Starting Point
After clearing out those orphaned backup files, my Storage dashboard was still showing 57GB in addons_data. That’s almost entirely MariaDB. For a home automation database that should mostly just be tracking light switches and temperature sensors, 57GB seemed… excessive.
I run MariaDB as my recorder database instead of the default SQLite. It handles larger datasets better and I can poke around in it with phpMyAdmin when things go sideways. Which is exactly what I needed to do here.
Finding the Hog
Before we go any further: Don’t just copy and paste my SQL queries and config changes blindly. Your entity IDs, metadata IDs, and sensor names will be different than mine. The methodology here is what matters. Figure out what’s bloating YOUR database, then adjust YOUR recorder config accordingly. Purging data is destructive and you can’t undo it. You’ve been warned.
First step was figuring out which tables were eating all that space. In phpMyAdmin:
SELECT
    table_name,
    ROUND(data_length / 1024 / 1024 / 1024, 2) AS data_gb,
    ROUND(index_length / 1024 / 1024 / 1024, 2) AS index_gb,
    table_rows
FROM information_schema.tables
WHERE table_schema = 'homeassistant'
ORDER BY data_length DESC
LIMIT 20;
And there it was:
| table_name | data_gb | index_gb | table_rows |
|---|---|---|---|
| states | 15.93 | 31.59 | 145031090 |
| statistics_short_term | 0.25 | 0.17 | 2878578 |
| statistics | 0.24 | 0.15 | 2425814 |
145 million rows in the states table. The indexes alone were 31GB. The actual data was only 16GB but the indexes to make it searchable were twice that size.
For context, the statistics tables that power the Energy Dashboard had about 2.4 million rows combined. Totally reasonable. The states table was the problem.
What’s Spamming the Database?
The states table stores every state change for every entity. Every time a light turns on, a temperature changes by 0.1 degrees, or a power sensor reports a new wattage value, that’s a row in the states table.
I had a suspicion about what was causing the bloat, but I wanted to confirm. Problem is, querying 145 million rows to find the worst offenders was going to be slow. My first attempt at a JOIN query to get entity names just hung there forever.
So I sampled the last million rows instead:
SELECT
    metadata_id,
    COUNT(*) as row_count
FROM states
WHERE state_id > (SELECT MAX(state_id) - 1000000 FROM states)
GROUP BY metadata_id
ORDER BY row_count DESC
LIMIT 30;
That came back in about 3 seconds with a list of metadata IDs. Then I looked up what those IDs actually were:
SELECT metadata_id, entity_id
FROM states_meta
WHERE metadata_id IN (1847, 2891, 1846, 1952, 1889, 2890, 1822, 2714, 1951, 1974);| metadata_id | entity_id |
|---|---|
| 1822 | sensor.power_2 |
| 1846 | sensor.power_5 |
| 1847 | sensor.energy_5 |
| 1889 | sensor.plug02_energy |
| 1951 | sensor.plug01_power |
| 1952 | sensor.plug01_energy |
| 1974 | sensor.plug06_energy |
| 2714 | sensor.plug09_energy |
| 2890 | sensor.plug08_power |
| 2891 | sensor.plug08_energy |
Every single top offender was a power or energy sensor. My ESP32 smart plugs were reporting wattage every second or two, and Home Assistant was dutifully recording every single update.
Quick math: one sensor reporting every second is 86,400 rows per day. I’ve got about 10 of these plugs. That’s 864,000 rows per day just from power monitoring. Over 90 days (my purge setting), that’s 77 million rows from power sensors alone.
The Fix: Recorder Excludes
Here’s the thing. I don’t actually need per-second power readings stored in the database. The Energy Dashboard uses the statistics tables, not the states table. All those power and energy readings in states are just… noise. Useful noise if I want to look at a graph of the last hour, but I definitely don’t need 90 days of it.
My original recorder config:
recorder:
  db_url: mysql://ha:[REDACTED]@core-mariadb/homeassistant?charset=utf8mb4
  purge_keep_days: 90
  commit_interval: 60
  db_retry_wait: 30
  exclude:
    domains:
      - media_player
      - camera
      - update
      - uptime
      - time_date
      - worldclock
    entity_globs:
      - sensor.*_power_factor
      - sensor.*_wifi_signal
    entities:
      - sensor.home_assistant_v2_db
      - sensor.memory_free
      - sensor.memory_use
      - sensor.memory_use_percent
      - sensor.processor_use
      - weather.openweathermap
I had some excludes in there, but I was missing the big offenders. Updated config:
recorder:
  db_url: mysql://ha:[REDACTED]@core-mariadb/homeassistant?charset=utf8mb4
  purge_keep_days: 30
  commit_interval: 60
  db_retry_wait: 30
  exclude:
    domains:
      - media_player
      - camera
      - update
      - uptime
      - time_date
      - worldclock
    entity_globs:
      - sensor.*_power_factor
      - sensor.*_wifi_signal
      - sensor.*_energy
      - sensor.energy_*
      - sensor.*_power
    entities:
      - sensor.home_assistant_v2_db
      - sensor.memory_free
      - sensor.memory_use
      - sensor.memory_use_percent
      - sensor.processor_use
      - weather.openweathermap
  include:
    entities:
      - sensor.power_3
Two big changes:
- purge_keep_days: 90 → 30 – Three months of history is overkill. 30 days is plenty.
- Added energy and power sensor excludes – Stop recording the per-second spam entirely.
You’ll notice I explicitly included sensor.power_3. That’s my sump pump. I have a template sensor that uses history_stats to count how many times the sump pump runs each day, and that needs the power sensor history to work. Everything else can go.
The Important Part: Energy Dashboard Still Works
This is the key thing I needed to verify before making these changes. The Energy Dashboard pulls from the statistics and statistics_short_term tables, NOT the states table. Excluding energy sensors from the recorder doesn’t affect the Energy Dashboard at all.
If you’ve spent hours fixing corrupted energy statistics (like I have), the last thing you want is to accidentally break it again by messing with recorder settings. These are separate systems.
Running the Purge
After updating the config and restarting Home Assistant, I needed to clear out the existing bloat. Developer Tools → Actions → recorder.purge:
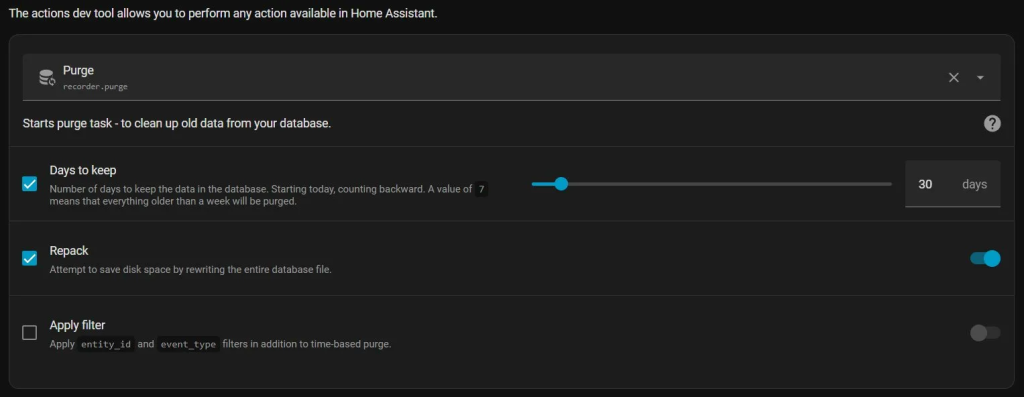
30 days to keep, and Repack enabled. The repack is important because it actually reclaims the disk space after deleting rows. Without it, MariaDB just marks the space as available but doesn’t shrink the files.
Hit perform action and… nothing. Got a checkmark but no confirmation message.
The Nervous Part
I ran a query to check if rows were being deleted:
SELECT table_rows FROM information_schema.tables
WHERE table_schema = 'homeassistant' AND table_name = 'states';
145 million rows. Waited a minute. Still 145 million rows.
Then I checked if the recorder was even writing new data:
SELECT MAX(state_id) FROM states;498,271,384. Waited 15 seconds. Still 498,271,384.
The recorder had completely stopped writing. That’s not good.
I started running diagnostics. Checked if Home Assistant was responsive (it was). Checked the process list in MariaDB:
SHOW PROCESSLIST;299 ha 172.30.x.x:59130 homeassistant Query 39 Sending data SELECT DISTINCT states.attributes_id FROM states ...There it was. A SELECT query running for 39 seconds, churning through the states table. The purge was working, it just had to query 145 million rows first before it could start deleting anything.
A few minutes later, checked the row count again:
SELECT table_rows FROM information_schema.tables
WHERE table_schema = 'homeassistant' AND table_name = 'states';
144,340,373. Down about 700,000 rows. Progress.
Checked the max state_id again:
SELECT MAX(state_id) FROM states;498,273,512. The recorder was writing again. The purge runs in chunks between normal database operations so it doesn’t completely lock things up.
The Waiting Game
At this point I realized this was going to take a while. The purge needs to delete about 115 million rows to get down to 30 days of data. At 700,000 rows every few minutes, that’s… hours. Maybe overnight.
Home Assistant’s purge runs in small batches intentionally. It’s designed to not lock up your database or tank your system while it works. Safe, but painfully slow when you’re dealing with this many rows. There are faster ways to nuke the data directly in MariaDB, but you risk orphaning related data in other tables or breaking something. The slow way is the right way here.
And then the repack at the end, which rewrites the entire database file to reclaim space, will probably take just as long.
I’m writing this post while the purge runs in the background. Tomorrow I’ll check back and see how much space we actually recovered.
The Results
I’ll be honest, I kind of forgot about this for a week. Life happens. When I came back to check on it, here’s what I found:
States table:
| Metric | Before | After |
|---|---|---|
| Rows | 145 million | 48 million |
| Data | 15.93 GB | 6.00 GB |
| Index | 31.59 GB | 6.75 GB |
Disk usage:
| Metric | Before | After |
|---|---|---|
| addons_data | 57 GB | 15.3 GB |
| Free space | 0 GB | 54.7 GB |
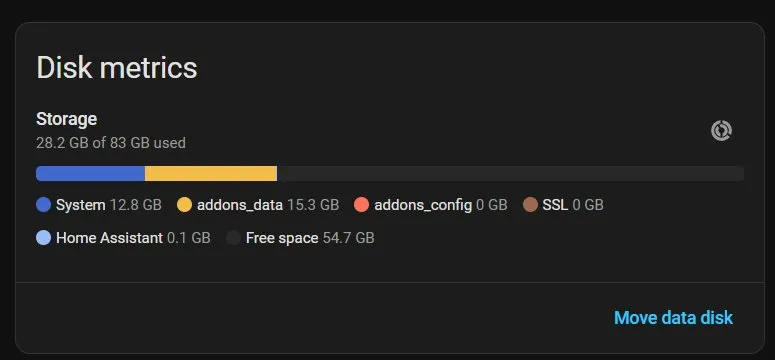
42 GB recovered. I can actually breathe again.
The Energy Dashboard still works perfectly with data going all the way back to late 2021. That’s because energy data lives in the statistics tables, not states. The purge only cleared out the per-second power reading spam that I never actually needed.
The whole process took about a week. Most of that was the delete phase chewing through 100+ million rows in tiny batches. The repack at the end probably added another day or two. Could I have nuked it faster with direct SQL? Probably. But I also could have broken something, and I didn’t feel like finding out.
Going forward, the new recorder config should keep things under control. No more recording every watt my smart plugs report. The Energy Dashboard doesn’t need it, and neither do I. Should have set this up years ago, but here we are.
If you’re sitting on a bloated MariaDB and wondering if it’s worth the hassle to fix, it is. Just don’t expect it to be quick. Start the purge, go live your life for a few days, and come back to a much happier database.
Quick Reference
Find what’s bloating your states table:
SELECT
    metadata_id,
    COUNT(*) as row_count
FROM states
WHERE state_id > (SELECT MAX(state_id) - 1000000 FROM states)
GROUP BY metadata_id
ORDER BY row_count DESC
LIMIT 30;
Look up entity names from metadata IDs:
SELECT metadata_id, entity_id
FROM states_meta
WHERE metadata_id IN (id1, id2, id3);
Check current table sizes:
SELECT
    table_name,
    ROUND(data_length / 1024 / 1024 / 1024, 2) AS data_gb,
    ROUND(index_length / 1024 / 1024 / 1024, 2) AS index_gb,
    table_rows
FROM information_schema.tables
WHERE table_schema = 'homeassistant'
ORDER BY data_length DESC;
Check if purge is running:
SHOW PROCESSLIST;